
River flows are an important consideration with respect to steelhead movement, resting and holding locations. Flow is arguably the single-most important variable in the context of fish movement, just as stream temperatures dictate when the majority of fish begin to run, when they spawn, where they locate within a stream when water temperatures are below 40°F, what they do when temperatures are above 40°F, and when they are most vulnerable to bait, fly, artificial, or hardware presentations. One of the tricks of the trade is to understand what you’re looking at in terms of flow and temperature because this helps you know where to look for the fish.
Most people are completely baffled when first looking at and trying to interpret flow charts. Applying the information and developing fishing strategies based on those conditions puts steelheading on an entirely different level. Minnesota Steelheader created this guide so that by the time you get done reading, you’ll be able to read and understand the charts like a pro. Do that and you’re ready to take the next step.
To understand any chart, it is necessary to understand terms that are used on all charts:
Cubic Feet per Second: ft3/s also “cfs” is the measurement of flow in streams and rivers. It is equal to a volume of water one foot high, one foot long, and one foot wide (a cube) moving a distance of one foot in one second. The higher the number, the higher the water volume flowing past the station at a given point in time. By way of comparison, 1 cubic foot per second of water volume is equal to approximately 7.5 gallons per second of water volume.
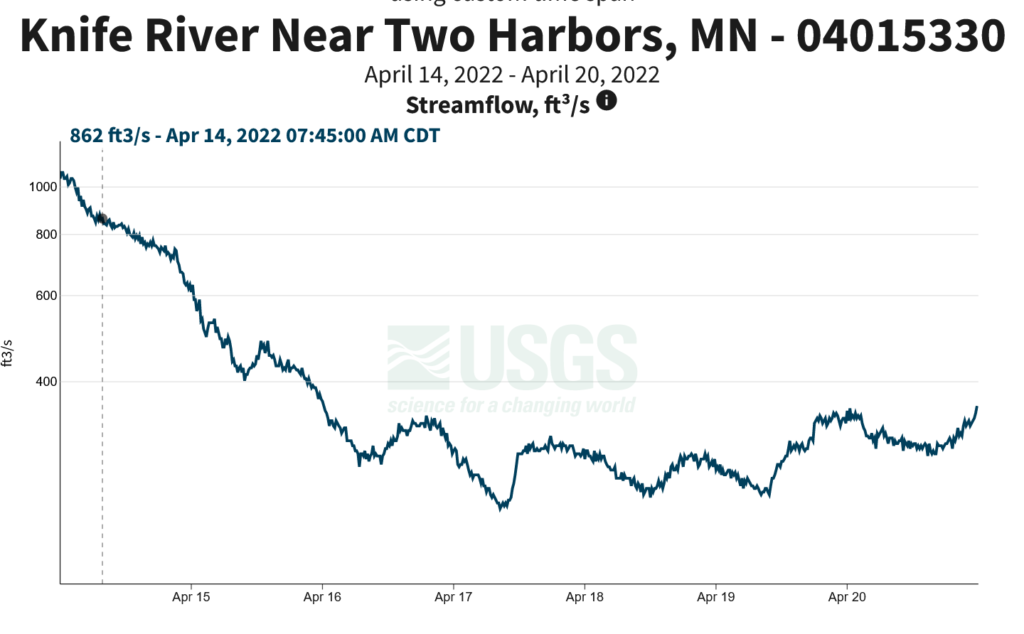
Discharge: The total volume of water which passes a given location within a given period of time expressed in cubic feet per second. Think of discharge as the total cfs measurement passing a distinct point in a tributary (wherever the station is located); the higher the number, the higher the flow. The discharge readings are displayed in cfs against the ft3/s scale at left. Figure 1 below highlights a Knife River reading of 862cfs (6,465 gallons per second!) taken at 7:45 a.m. on April 14th, 2022:
Exceedence: This is the toughest concept to wrap your brain around. Exceedence is an important way to describe the percentage of time for which a measured stream-flow is greater than, equal to, or less than all of the measured stream-flow values taken on a particular date. Exceedence is used because discharge is not normally distributed, e.g., flows go up and down, but don’t necessarily follow classic bell-shaped curves. Another confusing thing about exceedence is that it is an inverse relationship; low-flows generally have high exceedence percentages, and high-flows generally have low exceedence percentages.
Low-flow events have a high exceedence percentage because most of the time, the measured flow exceeds (is greater than) the low flow value. Similarly, high-flow events generally have low exceedence percentages because most of the time, measured flows are lower than the high-flow value. In other words, flows rarely exceed the value shown.
Exceedence is a precise way to understand exactly where a tributary is at: low, normal or high, and everywhere in-between for a given time of year. By contrast, mean (average) values are a more intuitive way to understand where a tributary is at for a given time of year. Once you understand exceedence, you’ll know exactly how far above or below average flows are, and what to do about it when developing a fishing plan for the day.
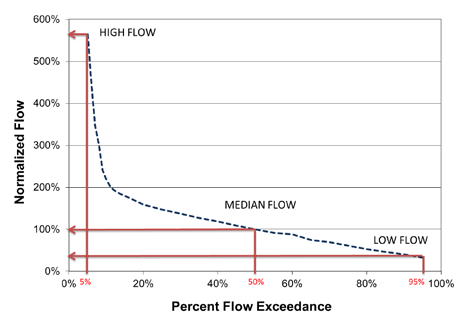
USGS generally provides two measurement of exceedence for streams, 20% and 80%. Note Figure 2 below presents 10%, Average, Median, and 80% exceedence for the purposes of the discussion.
In the example illustrated by the Figure 2, measured flows have been at or greater than a high-flow value of 75cfs only 10% of the time. Measured flows have been at or greater than 25cfs 80% of the time. The 50% exceedence value is the median flow. Of all measured flow values, half were greater, and half were lesser values. The average flows are just that, the average or mean of all measured flows.
Remember, any chart providing exceedence, mean and median values apply only to the flow measurements for the date you are looking at. Yesterday was different and so too will tomorrow’s exceedence, median and mean values be.
Why is this important and what does it have to do with fishing? When looking at any flow chart, you need to be able to interpret what is low, normal or high for that date and the specific time of year. Most fall readings on any given North Shore tributary are vastly different from spring readings. A fall flow reading that would be absurdly low in spring, could very well be a discharge rate that will draw fall fish like crazy.
Migratory fish “adjust” as it were to individual tributaries and their annual flow cycles. Somehow the fish know just what works for them in terms of flows at specific times of year. On one mid-Upper Shore stream, fall base flows are typically in the 2-7cfs range. Flows rising into the 20cfs range draws coasters, pink and coho salmon like crazy. A spring steelhead experiencing the same 20cfs flows would simply stay in the lake, or hunker down somewhere safe in the stream while waiting for flow values in 80-100cfs range.
Gage Height: The height of the water surface above the gage datum (zero point). Gage height is often used interchangeably with the more general term stage, although gage height is more appropriate when used with a gage reading. Gage heights generally correspond to distinct discharge readings and are the basis for Rating Curves. Many people think that gage and CFS are not related, but they are. A distinct gage reading generally corresponds to a distinct CFS reading. In a perfect world they would always correspond perfectly, but in the real world they mostly correspond. This leads to a technical argument regarding stream cross-sections and is not highly relevant to the discussion. Feel free to e-mail MNST if you need to know why and it’s keeping you up at night…
Figure 3 illustrates Gage Height and is the corresponding reading to Figure 1.
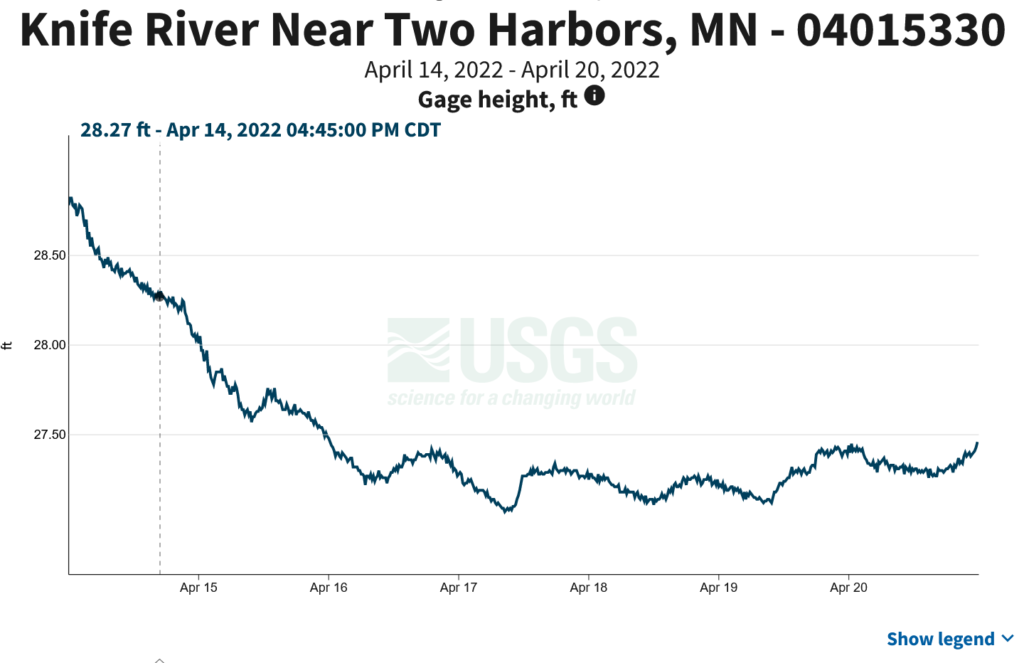
It really doesn’t matter whether you intuitively understand gage height or CFS better, the point is to be able to know what the readings mean, and how to apply “flow intelligence” to North Shore stream fishing.
Mean: The “average” in plain English. For a data-set such as discharge, the mean is the sum of all readings divided by the total number of observations for a given date. Figure 4 shows a stream’s means, medians and exceedence, plus bonus minimum and maximum flows recorded on May 11th over 32 years as depicted on a USGS chart:
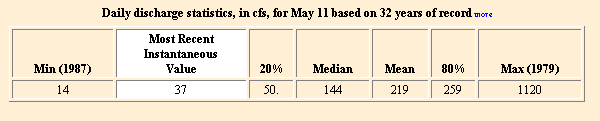
Here you can see that for May 11th, the flow of 37cfs is actually quite low. Well below the average of 219cfs, and not much higher than the lowest historically recorded flow value of 14cfs. It’s also well below the 20% exceedence value of 50cfs. This graphic is telling you a lot about what is likely going on with the fish, where to look for them, and what tactics and presentations you’ll need to use to be successful.
Median: The number dividing the upper half of a discharge data-set from the lower half. The median of a list of numbers is simply calculated by arranging all the observations on that date from highest to lowest value and using the one that falls smack in the middle.
Measuring Station: There are many different types of instruments used at stations to measure many different water parameters. Rather than confuse you with a list of instrument types, a measuring station is simply a tool ideally suited for profiling, monitoring, and recording water conditions in lakes, rivers & wetlands. Measuring stations may be as simple as a stick with measurement marks on it that’s affixed to a solid object, or a complex package containing multiple electronic sensors which record a range of water quality data such as: Gauge Height, Discharge, Turbidity (how much dirt is suspended in the water), Temperature, Electrical Conductivity and Dissolved Oxygen. If the station is equipped with “on board” memory and battery power, it can be left unattended for weeks at a time. Measurement parameters can be set to sample water data at pre-programmed intervals and securely save the data to the unit’s internal memory. Some stations transmit data automatically while others require physical retrieval from the water. The station’s information in those cases is downloaded to a computer and specialized software is used to graph and interpret the data.
Getting Started
There are a number of good resources for obtaining flow information for North Shore and other area tributaries. The first is the US Geological Survey Site
This link is specific to Minnesota and displays tributaries in a table format. Locate the stream you wish to view in detail and click its’ link. A useful feature of this table is that you can quickly scroll through all available tributaries and see what they are all doing at a glance. To get other State’s tributary data, select that State from the drop-down menu located at the top of the table. USGS is updating their display formats as of 2023, but you can jump to their legacy sites by clicking the Legacy Real-Time Page link near the top of the individual station page.
The second resource is: Lake Superior Duluth Streams
This link has a wealth of stream data beyond flows. It’s primarily focused on Duluth area streams, but does have archival data for several upper-shore streams. The data is displayed in a slightly different format, but still shows discharge and stage (gauge height). The site also includes temperature and precipitation tools. Data can be downloaded in Excel format although temperatures will be displayed in degrees Celsius. Their stations are typically removed from streams during winter, and getting up to date flow data regardless of season can be hit and miss.
The third resource is: Minnesota DNR Cooperative Stream Gaging Program.
This link displays stations in a map format. Pins are color-coded for quick exceedence reference, and there’s a nice pull-out reference legend. Scroll and zoom to the stream you wish to view and click the pin. Current conditions will be displayed in the pop-up box. If you wish to view the full station with details, click the page icon at lower left of the pop-up station box. Select stations include temperature data. Many other great tools to explore here.
Notes on available Minnesota tributary data: Because of the relative lack of available stations, you will have to make assumptions about flows on rivers that fall between stations. Generally this means watching weather stations or radar for precipitation events in addition to looking at streams with stations. The general rule of thumb is that a radius of 15-20 miles from each station is about the maximum distance you can assume general conditions of flow will be similar when comparing streams with stations to streams without stations. If flow is going up or down at a given station, it will be likely be going up or down accordingly on streams within 15-20 miles either direction. Radar helps you to get a feel for how widespread a precipitation event is, and whether streams within the 20-mile radius will be doing a similar thing.
For our discussion, we’ll us the data from the Knife River. You can follow along by opening the USGS Link and performing the following steps:
1. Open the USGS link to the Minnesota table
2. Click on the Knife River Station ID: 04015330
You should now see graphic displays of the gauge height. The default display is 7 days, but can be easily updated to 30 days, or a full year. The very top of the page has radio button selections to specify number of days to display. Below the chart is a selection to Show/Hide the chart legend. If you hover over the chart, you can use a scrolling mouse to zoom in and out for greater detail.
3. Scroll down the page to the Select Data to Graph section. You can change the primary display from Gage Height to Discharge or any of the other parameters listed by clicking the appropriate radio button. Check the Select Data to Graph on Second Y-Axis box to select any additional parameters you wish to chart listed below Available Secondary Data Types. The chart will automatically refresh the display giving you the full range of selected data. Note you can also manually change date ranges displayed by clicking the Change Time Span button located just above the Select Data section.
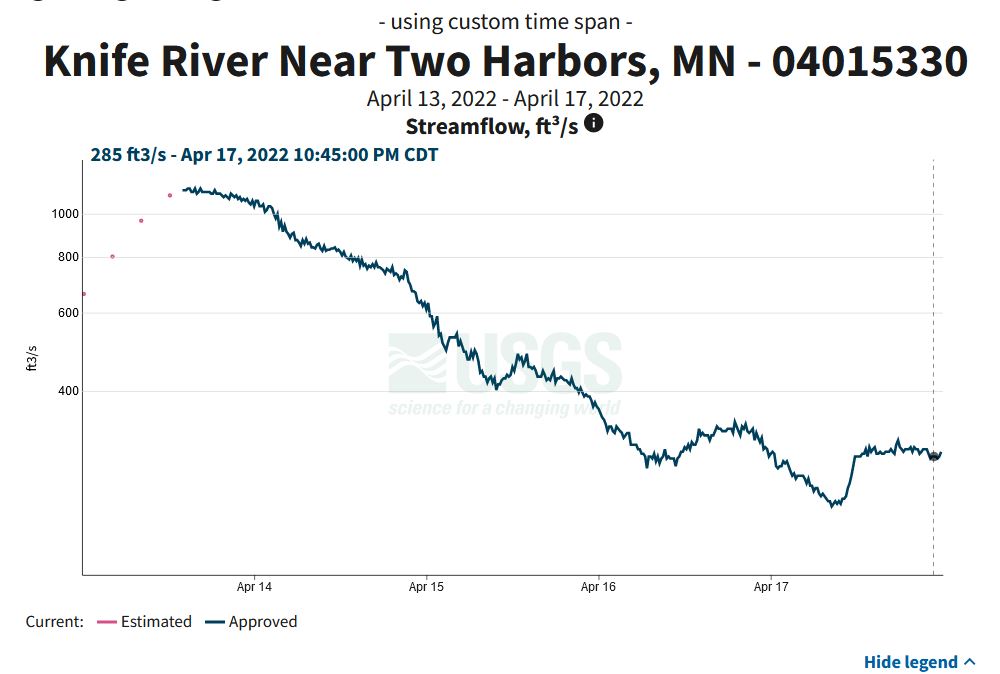
How to Play: Using the example provided above, you can see that current flow is somewhat stable at 285cfs on April 17th. Normally on the Knife, 285cfs is a very fishable level. It’s not too high or low, and depending on stream temperature, locating fish is not difficult. BUT, look what was happening over the three days prior to the 17th. Flows were dropping from over 1000cfs.
You can now draw several important conclusions from the available data. Even with the rapid drop in flows, the water is going to be dirty, and remain dirty with low clarity for at least a day or two until suspended sediment settles out of the water. It’s also likely streams immediately north and south of the Knife are potentially going to be dirty as well. Fish already in the stream are likely on the move, with new fish entering the river as water levels dropped below 500cfs. Assuming fresh fish and dirty water, the plan for the day would be starting with big/bright or big/dark presentations a fish can see in low visibility. You won’t have to be as stealthy, using light line, light leaders or light tippet, nor will any leader/tippet combos have to be as long as they would need to be if the water were relatively clear.
The next step is critical. Once you get to the river, get a water temperature reading as this will tell you where to start looking for the fish. Steelhead are ectothermic; they can’t metabolically control their own body temperature. In water temps below 40°F, they’ll seek out deeper pools and other areas of slow water as holding locations allowing them to conserve energy. Water temps above 40°F allow them to utilize much faster water as well as to move quickly from location to location. Under 40°F, start at available pools. Continue to take periodic temperature readings. If your early pool bite suddenly shuts down, water temps have likely climbed above 40°F. Start working faster water and looking for active, moving fish. ALWAYS carry a thermometer, and use it!
One final note: We’ve mentioned the term flow cycles several times. Again, each tributary has it’s own natural rhythm which the fish somehow adapt to. Each tributary also has a point at which the fish seem to shut down. Looking elsewhere can make or break a day. Because this is highly variable between Spring and Fall based on the cycle, the only way to know for sure is to watch for those means along with keeping track of your observations and success, or lack thereof, while comparing this against the available flow data. On the Knife in Spring for example, a 450-500cfs reading tells me that the river is basically what is referred to as, “blown out.” In other words it is high, dirty and just about un-fishable, not to mention dangerous to attempt wading.
DNR studies also demonstrate that fish movement on the Knife pretty much shuts down as you approach 500cfs. If you do see these high readings, but it’s the only time you can fish, at least you are going in armed. Fishing close to the bank between the points of outside turns, the mid-point of the inside bends, or any other sheltered area with really big, really bright or really dark baits or flies, is going to be the the order of the day. Using scent in dirty water can also be productive.
Similarly, a 150cfs spring reading on the Knife tells me that it is getting pretty low based upon past observations. However, some pretty good days fishing can be had at this level, so don’t count the Knife out. Just know you’ll have to change tactics and presentations to fit conditions. In Fall, a 150cfs reading by way of comparison should put a huge smile on anyone’s face.
What if you have never fished a particular tributary before? A good rule of thumb is that the closer a discharge reading is to the average/mean, the greater your chances are of finding active fish and being successful. Keep in mind thought that Spring and Fall means are normally very different, and that the actual flow may not be as important as how close the current flow is to the mean value. This is why it is important to consider them since the means indicate how close the current reading is by comparison to where it should be for that specific time of year. Also, migratory fish still respond to increasing and decreasing flows accordingly, and you have to take that into account.
Being able to interpret flow data goes a long way towards making you a more successful steelheader, as well as North Shore angler in general. Once you know how to interpret the data, you can quickly visualize what current conditions are, then formulate a plan: What streams to fish, where to fish on the stream, what setups to use, and presentations to try first. Now that you know how to read the charts, it’s all a matter of putting these concepts into practice.
One last item of significant import for North Shore steelheaders: Keep in mind that while flow is very important to overall fish movement and their preferred locations in streams under given flow conditions, be aware that water temperature also plays a significant role in run activity. You can have ideal flows shortly after ice-out, but if stream temperatures aren’t where they need to be, fishing can be slow and difficult at best. That’s not to say we don’t get early fish forays into the tributaries. MNST creel and DNR trap data show about 10% of adult steelhead returning to the streams as soon as they can navigate the mouths as ice is breaking up. The remaining 90% of steelhead returns are highly dependent upon temperature.
Here’s a quote from multiple DNR Adult Trap Operation Reports regarding Spring Environmental Variables: “Upstream movement of adult steelhead in the spring initiates when maximum daily water temperatures exceed 4.4°C (39.92°F) and mean daily water temperatures exceed 3.3°C (37.94°F).” Schreiner et.al. Minnesota DNR.
MNST calls this somewhat complex relational temperature concept, “Major Migration Threshold” or “MMT” for short. An easier way to think of it is what we call “Magic 40°F”. If streams have not yet hit Magic 40°F, your tactics are different than Magic 40°F and above when flow once again takes over as the primary influence on upstream fish movement. But that’s a topic for a different blog post.
Regards and Good Fishing!
NMF
©Minnesota Steelheader